
Over the past several months, I have written several articles about building GUI-based PowerShell scripts. While these articles discuss a wide range of techniques and GUI elements, there is one extremely useful yet seldom discussed element I haven’t covered: the TrackBar, also known as the Slider or Slide Bar.
- Creating and Customizing Sliders
- A Slider as Zoom Control
- Sliders in Data Visualizations
- Multiple Sliders
Sliders are valuable because they give users a way to experiment with a range of values, without you, the script’s author, having to worry about the user inputting inappropriate values.
In this article, I will demonstrate a few ways to integrate sliders into your scripts. However, before doing so, I want to first discuss the basics of how sliders work. To illustrate this, I’ve created a simple PowerShell script that displays a slider on the screen. You can see what this script looks like in Figure 1, with the corresponding source code just below the figure.
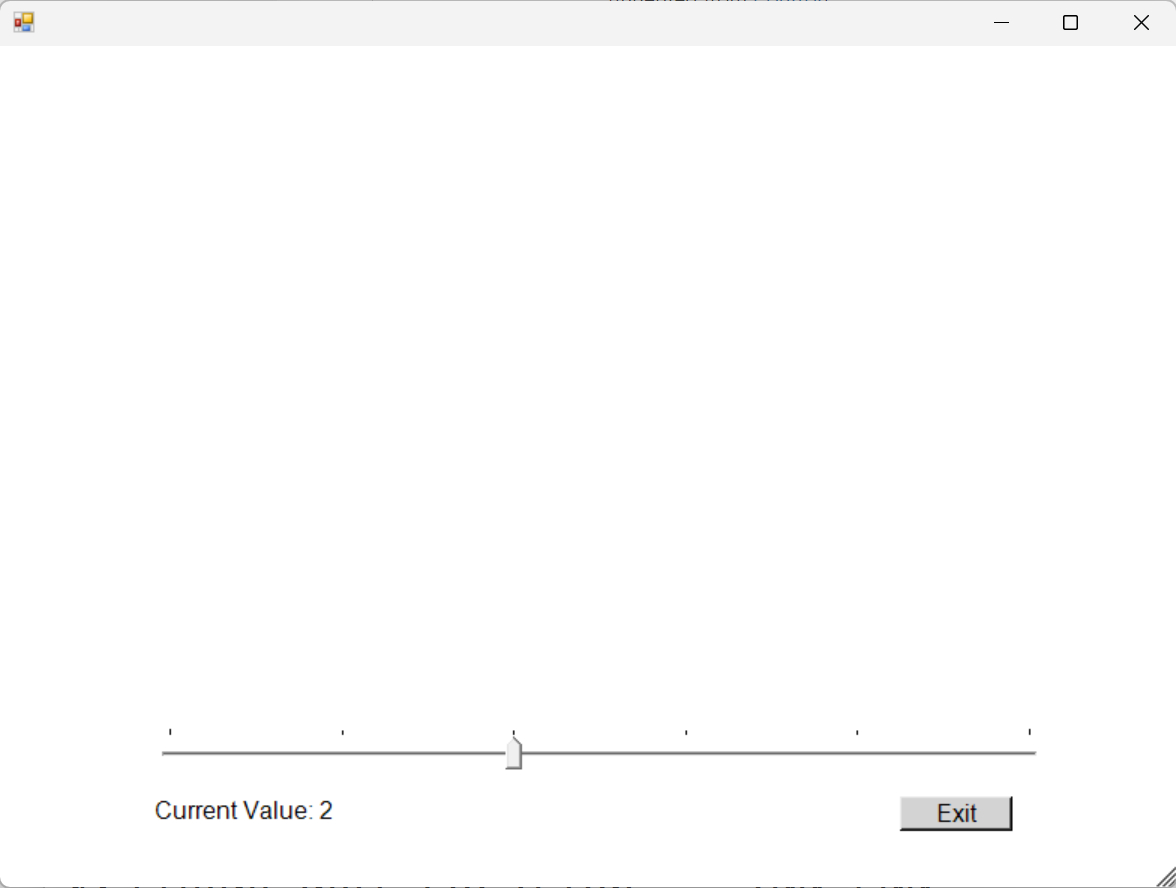
Figure 1. This is what a slider looks like.
Figure 1 shows a simple slider near the bottom of the screen. Tick marks above the slide bar show the positions corresponding to various values. Directly below the slider, there’s a line of text (which is technically referred to as a label) displaying the slider’s current value, alongside an exit button. The label dynamically changes as you adjust the slider left and right.
Here is the source code:
Add-Type -AssemblyName System.Windows.Forms

$Form = New-Object Windows.Forms.Form
$Form.BackColor = [System.Drawing.Color]::White
$Form.Font = "Arial,12"
$Form.size = "800,600"

$Slider = New-Object Windows.Forms.TrackBar
$SliderLabel = New-Object System.Windows.Forms.Label
$ExitButton = New-Object System.Windows.Forms.Button


# Slider TrackBar

$Slider.Location = "100,450"
$Slider.Orientation = "Horizontal"
$Slider.Width = 600
$Slider.Height = 100
$Slider.TickStyle = "TopLeft"
$Slider.SetRange(0,5)
$Slider.Value = 2

$Slider.add_ValueChanged({
        $SliderValue = $Slider.Value
                  $TextString = 'Current Value: ' + $SliderValue
        $SliderLabel.Text = $TextString

    })

$Form.Controls.add($Slider)

# Exit Button
$ExitButton.Location = "600,500"
$ExitButton.Size = "75,23"
$ExitButton.BackColor = "LightGray"
$ExitButton.Text = "Exit"
$ExitButton.add_Click({$Form.close()})
$Form.Controls.Add($ExitButton)

# Slider Label
$SliderLabel.Location = "100,500"
$SliderLabel.Size = "500, 90"

$SliderValue=$Slider.Value
$TextString = 'Current Value: ' + $SliderValue
$SliderLabel.Text = $TextString
$SliderLabel.Text = $TextString
$Form.Controls.Add($SliderLabel)

$Form.ShowDialog()| Out-Null
GUI-based PowerShell scripts rely on the use of Windows Forms. Essentially, you create a form, then create and add objects, such as buttons, labels, and sliders, to it.
My script begins by adding the required Forms assembly and then proceeds to define the form itself. The form definition associates a name ($Form) with the form and sets the form’s font, background color, and size.
The next block of code creates the objects that will later be added to the form. These objects include the slider, a label, and a button.
The remaining sections assign various attributes to the objects that have been defined. In the case of the button, for example, these attributes include things like the button’s color and the text that is printed on the button. Since this article’s goal is to discuss sliders, I’m not going to go into the details of building buttons and labels here.
Creating and Customizing Sliders
As previously mentioned, a slider is technically known as a TrackBar. As such, here is the command that creates the slider object:
$Slider = New-Object Windows.Forms.TrackBar
As you can see, the object is a TrackBar object, but for simplicity’s sake, I named the object $Slider. Now that the object has been created, we need to associate some attributes with the object. Here are the attributes that I am using:
$Slider.Location = "100,450"
$Slider.Orientation = "Horizontal"
$Slider.Width = 600
$Slider.Height = 100
$Slider.TickStyle = "TopLeft"
$Slider.SetRange(0,5)
$Slider.Value = 2

$Slider.add_ValueChanged({
        $SliderValue = $Slider.Value
                  $TextString = 'Current Value: ' + $SliderValue
        $SliderLabel.Text = $TextString

    })
The first attribute determines the position of the slider within the form. It specifies that the slider will be located 100 pixels to the right and 450 pixels below the form’s upper-left corner.
The next line of code defines the slider’s orientation. In this instance, I have created a horizontal slider, although I could have just as easily made a vertical slider.
The next two lines set the size of the slider to 600 pixels wide and 100 pixels high.
Next, I set the tick style. The tick style refers to the evenly spaced marks that appear just above the slider. Here, the tick style is set to TopLeft, causing the ticks to appear above the slider. However, the ticks could have been placed below the slider or even omitted altogether.
The next two lines are among the most important. They determine the slider’s range and default value. In this case, the range is from 0 to 5, and the default value is set to 2. These values are arbitrarily chosen for demonstration purposes. In a practical scenario, you would tailor the range to correspond with what the slider is intended to control. I will show you a few examples later in this article.
The last portion of the block of code is the ValueChanged section. This section controls what happens when you move the slider to a different position. This section works similarly to the click action associated with a button object, but with a key difference: A slider has an associated value.
In this example, the ValueChanged section contains only three commands. The first command establishes a variable named $SliderValue and assigns it to the value determined by the slider’s position adjustment. The second line defines a text string responsible for displaying the updated value. Finally, the third line of code displays the text string, showing the new value resulting from the slider movement.
Although I have covered the basics of setting up a slider within a PowerShell script, two additional commands are necessary for the slider to function properly.
The first of the commands is:
$Form.Controls.add($Slider)
This command adds the slider to the form. Remember, the slider object has a name associated with it – in this case, $Slider. Thus, this command adds the $Slider object to the form object, named $Form.
The second required command is:
$Form.ShowDialog()| Out-Null
This command usually appears at the end of a GUI-based script. It prompts the form to be displayed on the screen.
A Slider as a Zoom Control
Having demonstrated how to create a slider in PowerShell, I want to now illustrate a couple of real-world use cases.
When I considered the potential uses of a slider, the idea of using it as a zoom control immediately came to mind. Of course, there are countless possible variations of this concept. For instance, you could use a slider to zoom in on a specific detail displayed on the screen. Likewise, it could serve as a tool to adjust the level of detail shown in a report. To illustrate how a slider can function as a zoom tool, I created a simple script that lets you use a slider to increase or decrease the font size. You can see what this script looks like in Figure 2.
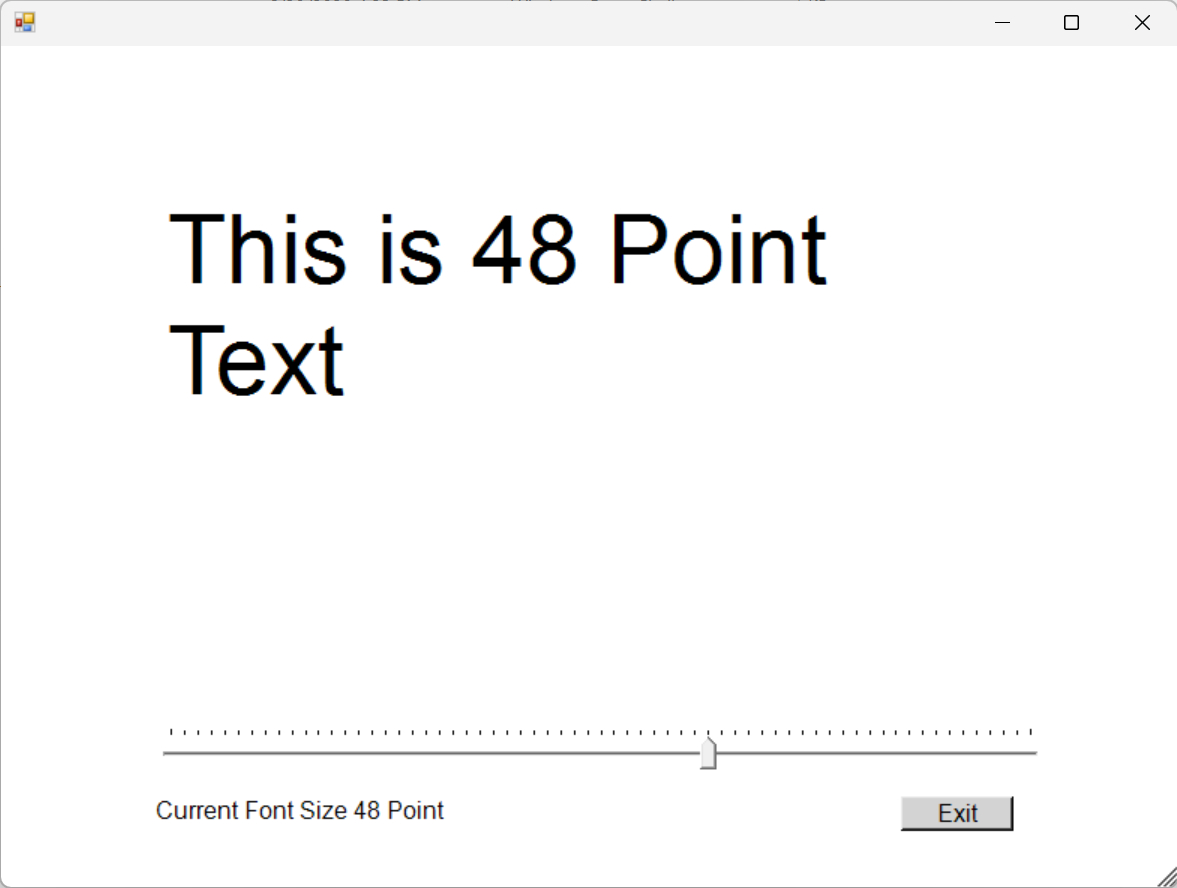
Figure 2. You can use a slider to adjust the font size.
In this example, moving the slider to the right increases the font size, while moving the slider to the left decreases the font size.
Here is what the source code looks like:
Add-Type -AssemblyName System.Windows.Forms

$Form = New-Object Windows.Forms.Form
$Form.BackColor = [System.Drawing.Color]::White
$Form.Font = "Arial,12"
$Form.size = "800,600"

$Slider = New-Object Windows.Forms.TrackBar
$SliderLabel = New-Object System.Windows.Forms.Label
$ZoomLabel = New-Object System.Windows.Forms.Label
$ExitButton = New-Object System.Windows.Forms.Button

# Slider TrackBar

$Slider.Location = "100,450"
$Slider.Orientation = "Horizontal"
$Slider.Width = 600
$Slider.Height = 100
$Slider.TickStyle = "TopLeft"
$Slider.SetRange(8,72)
$Slider.Value = 12

$Slider.add_ValueChanged({
        $SliderValue = $Slider.Value
                  $TextString = 'Current Font Size ' + $SliderValue + ' Point'
        $SliderLabel.Text = $TextString

                  $FontString="Arial," + $SliderValue
                  $ZoomLabel.Font = $FontString

                  $ZoomTextString = 'This is ' + $SliderValue + ' Point Text'
                  $ZoomLabel.Text = $ZoomTextString

    })

$Form.Controls.add($Slider)

# Exit Button
$ExitButton.Location = "600,500"
$ExitButton.Size = "75,23"
$ExitButton.BackColor = "LightGray"
$ExitButton.Text = "Exit"
$ExitButton.add_Click({$Form.close()})
$Form.Controls.Add($ExitButton)

# Slider Label
$SliderLabel.Location = "100,500"
$SliderLabel.Size = "500, 90"

$SliderValue=$Slider.Value
$TextString = 'Current Font Size ' + $SliderValue + ' Point'
$SliderLabel.Text = $TextString
$SliderLabel.Text = $TextString
$Form.Controls.Add($SliderLabel)

# Zoom Text
$ZoomLabel.Location = "100,100"
$ZoomLabel.Size = "500, 200"
$Form.Font = "Arial,12"
$ZoomLabel.Text = 'This is ' + $SliderValue + ' Point Text'
$Form.Controls.Add($ZoomLabel)

$Form.ShowDialog()| Out-Null
This script is nearly identical to the one I discussed earlier in this article. The difference is that I have created an additional object – a label named ZoomLabel. When creating a label in PowerShell, you have the option to associate a specific font and point size with it. For example, this command tells the label to use 12-point Arial as its font:
$ZoomLabel.Font = "Arial,12"
Rather than hardcoding a font point size as I did in the line above, I tied the point size to the slider. As you may recall from earlier, every slider has an associated range. In this instance, I’ve set the range from 8 to 72, corresponding to font point sizes ranging from 8 point to 72 point. As the slider moves, the font point size dynamically adjusts, allowing you to essentially zoom in on the example text. This is all done using these two lines of code:
                  $FontString="Arial," + $SliderValue
                  $ZoomLabel.Font = $FontString
Here, I am creating a string containing the name of a font and a point size. Instead of directly specifying a fixed point size, I am substituting the slider value. This approach allows for dynamic control over the font size.
Sliders in Data Visualizations
Data visualizations make for another interesting use case for slide bars. For example, imagine that you have built a financial app that displays potential investment returns based on the length of time you let it grow. Using a slider, users can experiment with different time ranges, allowing for dynamic exploration of investment outcomes.
While I get that most people don’t use PowerShell to build financial apps, that’s beside the point. A slider can be useful in any script that lets you play with various “what if” situations. Moreover, when you create such a tool, PowerShell can display the results within a chart, as shown in Figure 3.
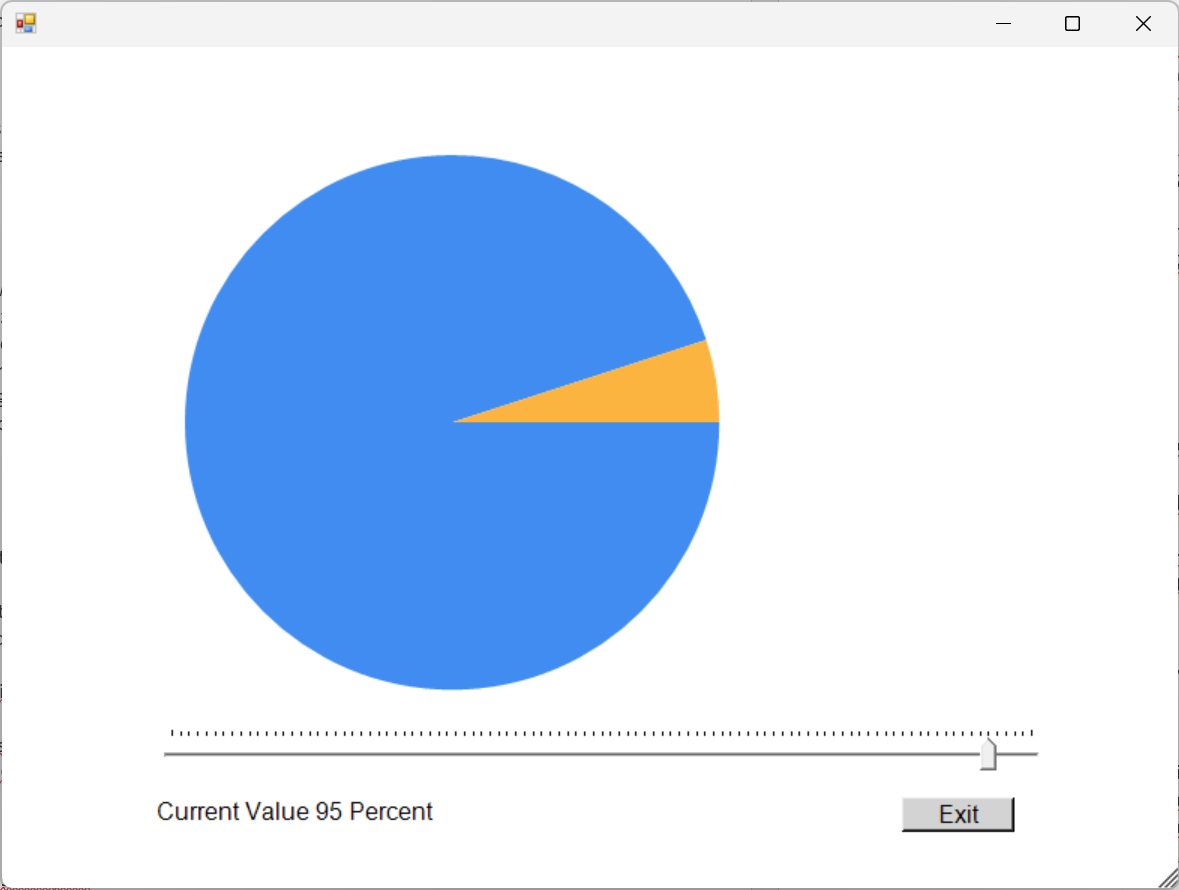
Figure 3. Sliders can be used for real-time visualization of what-if scenarios.
In this case, I intentionally refrained from linking the slider to any sort of formula. Instead, I opted to keep the script generic to highlight the versatility of this technique across various scenarios.
What I’ve done is create a pie chart representing 100% of a given amount. The slider I’ve implemented ranges from 0 to 100. As you drag the slider back and forth, the chart dynamically updates to reflect the value corresponding to the slider’s position.
Here is the source code:
Add-Type -AssemblyName System.Windows.Forms
Add-Type -AssemblyName System.Windows.Forms.DataVisualization

$Form = New-Object Windows.Forms.Form
$Form.BackColor = [System.Drawing.Color]::White
$Form.Font = "Arial,12"
$Form.size = "800,600"

$Slider = New-Object Windows.Forms.TrackBar
$SliderLabel = New-Object System.Windows.Forms.Label
$ExitButton = New-Object System.Windows.Forms.Button

# Slider TrackBar

$Slider.Location = "100,450"
$Slider.Orientation = "Horizontal"
$Slider.Width = 600
$Slider.Height = 100
$Slider.TickStyle = "TopLeft"
$Slider.SetRange(0,100)
$Slider.Value = 25
$A=$Slider.Value
$B=(100-$A)

$Slider.add_ValueChanged({
        $SliderValue = $Slider.Value
                  $A=$SliderValue
                  $B=(100-$A)
                  $TextString = 'Current Value ' + $SliderValue + ' Percent'
        $SliderLabel.Text = $TextString

                  # Update Chart
                  $Series.Points.Clear()


                  $DataPoints = @{
        "Category A" = $A
                  "Category B" = $B
                  }

                  $DataPoints.Keys | ForEach-Object {
        $Point = New-Object System.Windows.Forms.DataVisualization.Charting.DataPoint
        $Point.YValues = $dataPoints[$_]
        $Series.Points.Add($point)
                  }
                  $Chart.Refresh()
    })

$Form.Controls.add($Slider)

# Create a Chart object
$chart = New-Object System.Windows.Forms.DataVisualization.Charting.Chart
$chart.Width = 500
$chart.Height = 400
$chart.Left = 50
$chart.Top = 50

# Add a chart area to the chart
$ChartArea = New-Object System.Windows.Forms.DataVisualization.Charting.ChartArea
$Chart.ChartAreas.Add($chartArea)

# Add a series to the chart
$Series = New-Object System.Windows.Forms.DataVisualization.Charting.Series
$series.ChartType = [System.Windows.Forms.DataVisualization.Charting.SeriesChartType]::Pie
$Series.Name = "Data"
$Chart.Series.Add($series)

$dataPoints = @{
        "Category A" = $A
        "Category B" = $B
    }

$dataPoints.Keys | ForEach-Object {
        $point = New-Object System.Windows.Forms.DataVisualization.Charting.DataPoint
        $point.YValues = $dataPoints[$_]
        $series.Points.Add($point)
                  }

# Add the chart to the form
$Form.Controls.Add($Chart)


# Exit Button
$ExitButton.Location = "600,500"
$ExitButton.Size = "75,23"
$ExitButton.BackColor = "LightGray"
$ExitButton.Text = "Exit"
$ExitButton.add_Click({$Form.close()})
$Form.Controls.Add($ExitButton)

# Slider Label
$SliderLabel.Location = "100,500"
$SliderLabel.Size = "500, 90"

$SliderValue=$Slider.Value
$TextString = 'Current Value ' + $SliderValue + ' Percent'
$SliderLabel.Text = $TextString
$SliderLabel.Text = $TextString
$Form.Controls.Add($SliderLabel)

$Form.ShowDialog()| Out-Null
The script is obviously more complex compared to the other scripts I’ve presented. Even so, it still adheres to the same basic concept of creating a form, creating objects, adding attributes to these objects, and then adding the objects to the form. Here, one of the objects I added is a chart – specifically a pie chart, though the chart type is an attribute.
When creating a chart in PowerShell, you add data to the chart in the form of datapoints. Datapoints are essentially just the values to be displayed. For example, if you wanted to display the number 5 on a chart, you would assign the value 5 to one of the chart’s datapoints.
In this scenario, the pie chart contains two datapoints. As mentioned earlier, the chart represents 100% of a certain amount. As such, one of the two datapoints corresponds to the slider’s value. The slider, ranging from 0 to 100, stores its value in a variable named $A. The other datapoint is tied to a variable named $B. The $B variable equals 100 minus the value stored in $A. Hence, the sum of $A + $B will always equal 100.
Normally, charts created within PowerShell are static, meaning you can’t dynamically update them as values change. The way that I got around this limitation was to handle the entire process through the slider’s ValueChanged section. That section contains the following code:
$Slider.add_ValueChanged({
        $SliderValue = $Slider.Value
                  $A=$SliderValue
                  $B=(100-$A)
                  $TextString = 'Current Value ' + $SliderValue + ' Percent'
        $SliderLabel.Text = $TextString

                  # Update Chart
                  $Series.Points.Clear()


                  $DataPoints = @{
        "Category A" = $A
                  "Category B" = $B
                  }

                  $DataPoints.Keys | ForEach-Object {
        $Point = New-Object System.Windows.Forms.DataVisualization.Charting.DataPoint
        $Point.YValues = $dataPoints[$_]
        $Series.Points.Add($point)
                  }
                  $Chart.Refresh()
    })
The section assigns values to the $A and $B variables, then it creates the text string displayed at the bottom of the screen to reflect the slider’s value.
In terms of updating the chart, I use the $Series.Points.Clear() command to remove existing datapoints from the chart. I then assign new datapoints based on the values of the $A and $B variables. Finally, I use the $Chart.Refresh() command to update the chart so that the new values are displayed.
So, in this case, I am literally just displaying the slider’s value on a chart. However, it would be just as easy to pass the slider’s value to a formula (such as an interest computation formula), and then chart the formula’s output as opposed to charting the raw slider value.
Multiple Sliders
For those wondering, it is possible to add multiple sliders to a form. You need only to make sure that each slider has a unique name. Moreover, it is possible to combine the techniques that I have outlined in this article. For example, if you look at Figure 4, you can see that I have added a second slider to my script. This slider controls the size of the chart (allowing you to zoom in and out).
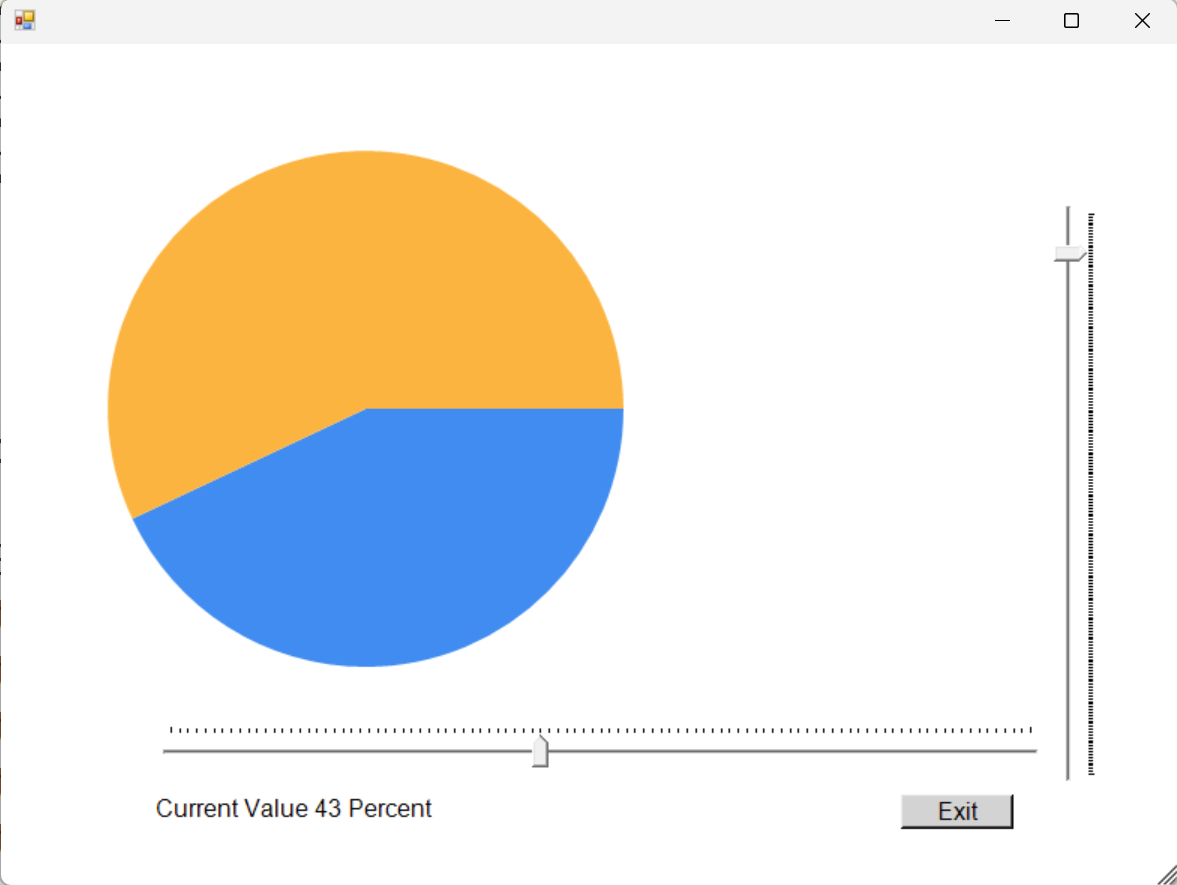
Figure 4. You can include multiple sliders within a single form.
The code for my second slider is nearly identical to that of the original slider. The biggest difference is that I had to specify a different size and location. I also set the second slider to be vertical.
The second slider’s Value Changed action simply changes the chart’s width and height based on the slider’s value. This slider ranges from 200 to 400, which corresponds to the number of pixels the chart occupies. Its default value is set to 300 pixels.
You can see the source code below:
Add-Type -AssemblyName System.Windows.Forms
Add-Type -AssemblyName System.Windows.Forms.DataVisualization

$Form = New-Object Windows.Forms.Form
$Form.BackColor = [System.Drawing.Color]::White
$Form.Font = "Arial,12"
$Form.size = "800,600"

$Slider = New-Object Windows.Forms.TrackBar
$Slider2 = New-Object Windows.Forms.TrackBar
$SliderLabel = New-Object System.Windows.Forms.Label
$ExitButton = New-Object System.Windows.Forms.Button

# Slider TrackBar


$Slider.Location = "100,450"
$Slider.Orientation = "Horizontal"
$Slider.Width = 600
$Slider.Height = 100
$Slider.TickStyle = "TopLeft"
$Slider.SetRange(0,100)
$Slider.Value = 25
$A=$Slider.Value
$B=(100-$A)

$Slider.add_ValueChanged({
        $SliderValue = $Slider.Value
                  $A=$SliderValue
                  $B=(100-$A)
                  $TextString = 'Current Value ' + $SliderValue + ' Percent'
        $SliderLabel.Text = $TextString

                  # Update Chart
                  $Series.Points.Clear()


                  $DataPoints = @{
        "Category A" = $A
                  "Category B" = $B
                  }

                  $DataPoints.Keys | ForEach-Object {
        $Point = New-Object System.Windows.Forms.DataVisualization.Charting.DataPoint
        $Point.YValues = $dataPoints[$_]
        $Series.Points.Add($point)
                  }
                  $Chart.Refresh()
    })

$Form.Controls.add($Slider)


# Create a Chart object
$Chart = New-Object System.Windows.Forms.DataVisualization.Charting.Chart
$Chart.Width = 300
$Chart.Height = 300
$Chart.Left = 50
$Chart.Top = 50

# Add a chart area to the chart
$ChartArea = New-Object System.Windows.Forms.DataVisualization.Charting.ChartArea
$Chart.ChartAreas.Add($chartArea)

# Add a series to the chart
$Series = New-Object System.Windows.Forms.DataVisualization.Charting.Series
$series.ChartType = [System.Windows.Forms.DataVisualization.Charting.SeriesChartType]::Pie
$Series.Name = "Data"
$Chart.Series.Add($series)

$dataPoints = @{
        "Category A" = $A
        "Category B" = $B
    }

$dataPoints.Keys | ForEach-Object {
        $point = New-Object System.Windows.Forms.DataVisualization.Charting.DataPoint
        $point.YValues = $dataPoints[$_]
        $series.Points.Add($point)
                  }

# Add the chart to the form
$Form.Controls.Add($Chart)

$Slider2.Location = "700,100"
$Slider2.Orientation = "Vertical"
$Slider2.Width = 100
$Slider2.Height = 400
$Slider2.SetRange(200,400)
$Slider2.Value = 300
$Slider2.add_ValueChanged({
                  $Chart.Width = $Slider2.Value
                  $Chart.Height = $Slider2.Value

})
$Form.Controls.add($Slider2)

# Exit Button
$ExitButton.Location = "600,500"
$ExitButton.Size = "75,23"
$ExitButton.BackColor = "LightGray"
$ExitButton.Text = "Exit"
$ExitButton.add_Click({$Form.close()})
$Form.Controls.Add($ExitButton)

# Slider Label
$SliderLabel.Location = "100,500"
$SliderLabel.Size = "500, 90"

$SliderValue=$Slider.Value
$TextString = 'Current Value ' + $SliderValue + ' Percent'
$SliderLabel.Text = $TextString
$SliderLabel.Text = $TextString
$Form.Controls.Add($SliderLabel)

$Form.ShowDialog()| Out-Null
About the author
 Brien Posey is a bestselling technology author, speaker, and 21x Microsoft MVP. In addition to his ongoing work in IT, Posey has trained as a commercial astronaut candidate in preparation to fly on a mission to study polar mesospheric clouds from space.


